
Discrete Choice Analysis and Price Optimization with Excel
Two weeks ago, I’ve built a conjoint analysis model to determine the relative importance of product attributes. Today, we will use a different approach, discrete choice analysis, to yield the same information.
Unlike conjoint analysis that requires consumers to rank the level of each product attribute, discrete choice analysis need not to do that. Conjoint analysis uses multiple linear regression whereas discrete choice analysis adopts logistic regression, using maximum likelihood estimation and the logit model to estimate the ranking of product attributes for the population represented by the sample.
So what exactly can we do with the results of a discrete choice analysis? Well, a lot. For example, we can estimate price sensitivity and brand equity for different Tobacco and determine the profit maximizing price of them. We can estimate price elasticity. We can even model how companies should dynamically change prices overtime. It is amazing how much we can do by learning a bit of information about consumer preferences.

Today I would like to incorporate price sensitivity and brand equity into discrete choice analysis to add some fun and twist to it. I’ll be using a completely made up data set of 100 consumer showing 8 price scenarios for One Piece figures, Dragon Ball figures and Pokemon figures. Why manga figures? Because I live for manga. Each consumer will be asked which figure they would buy for the given prices, they can choose to buy nothing.
To apply discrete choice analysis to estimate price sensitivity and brand equity, we can go ahead and assume the product value will be computed as below:
Value Pokemon = Pokemon brand weight + (Pokemon Price)*(Pokemon price sensitivity)
The trick is to use maximum likelihood estimation to estimate the brand weight, price sensitivity and find the Log likelihood for each set of prices. Maximizing Log likelihood allow us to determine the set of weights that maximize the chance to observe actual observed choice data.

First step, set up trial values for brand coefficients and price sensitivities for each product (highlighted yellow). For “Pick nothing”, set the brand coefficient to zero.
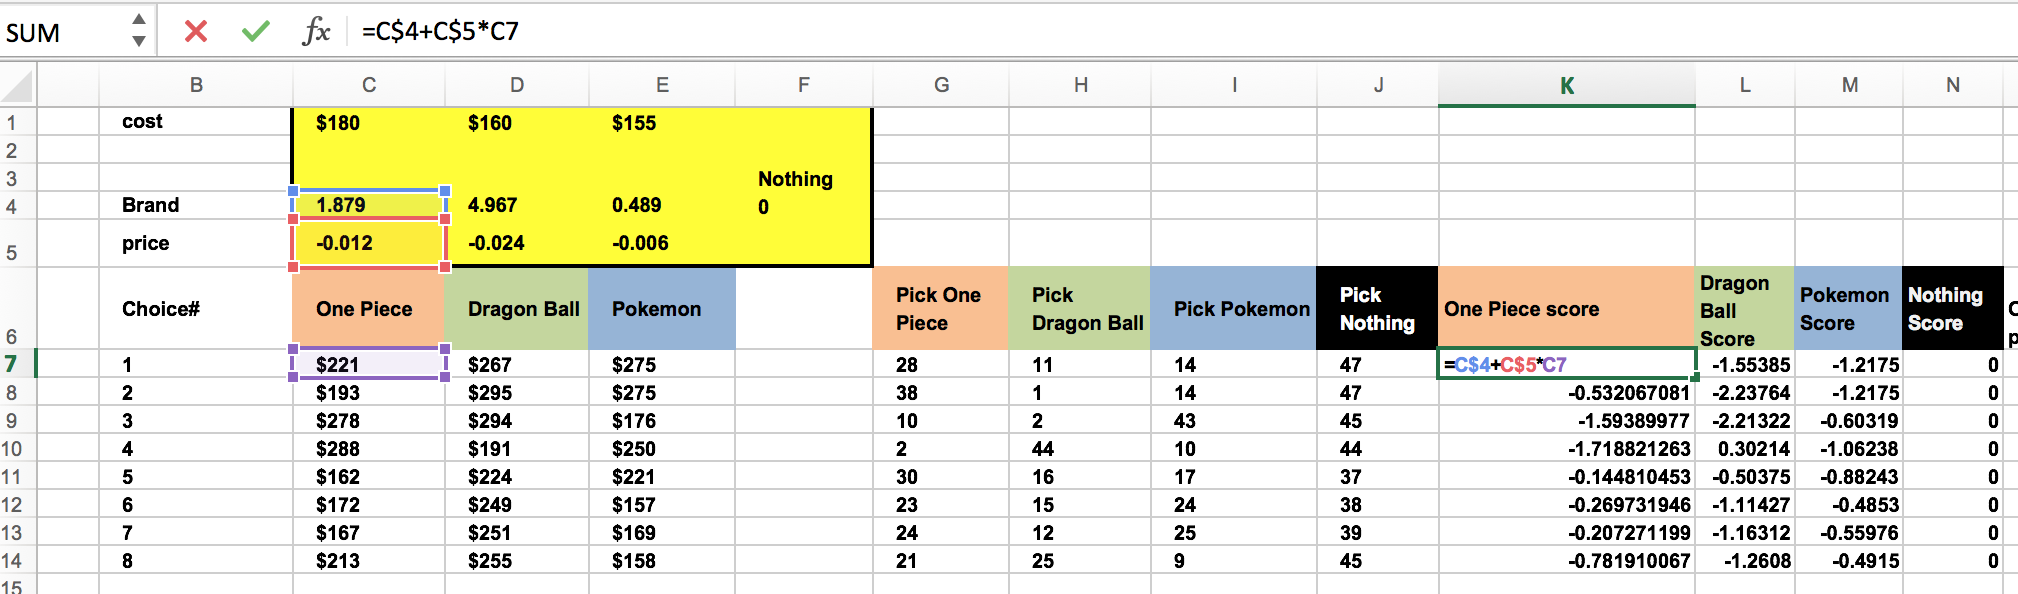
Then, use the product value equation mentioned above to generate scores for each product and scenario. Value Product = Product brand weight + (Product Price)*(Product price sensitivity). For “Nothing” the score is zero.

Next, compute the probability for each price scenario that each manga figure (or nothing) is chosen. Use the formula =EXP(K7)/(EXP($K7)+EXP($L7)+EXP($M7)+EXP($N7)).
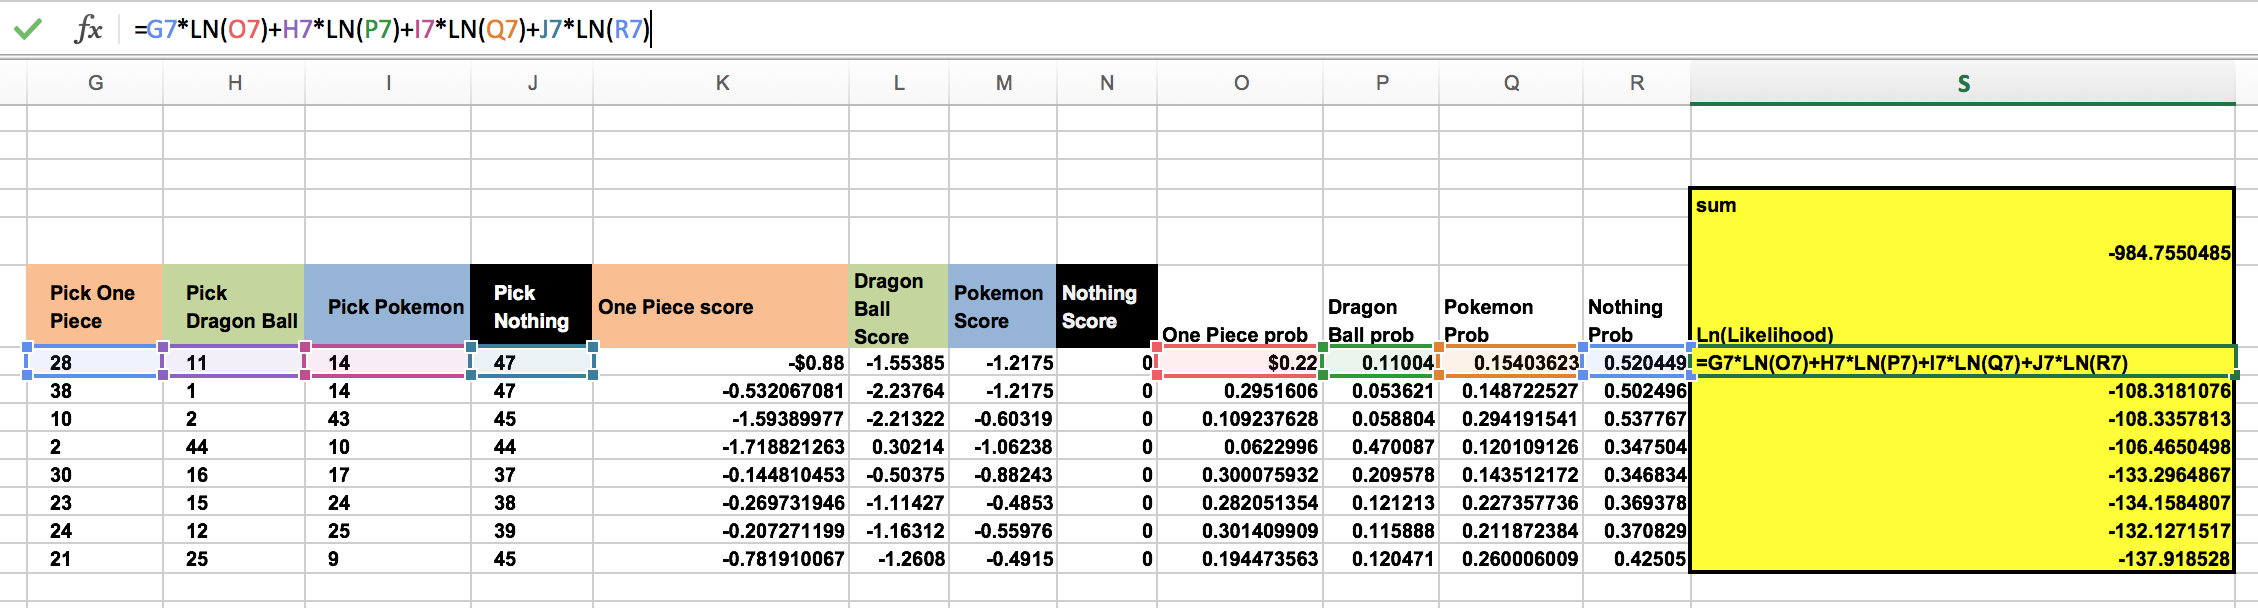
Now we get to calculate the likelihood of observed results for each scenario. The equation should be (Prob of One Piece)^28(Prob of Dragon Ball)^11(Prob Pokemon)^14(Prob Nothing)^47. Our goal is to maximize the sum of the logarithms of likelihoods for each scenario. In this case, the likelihood of One Piece Chosen is =G7*LN(O7)+H7*LN(P7)+I7*LN(Q7)+J7*LN(R7). Remember to create a target cell to compute maximum likelihood estimates for changing cells we set up earlier (trial price, cost and brand).

Run solver to determine the brand weights and price sensitivities that maximize the sum of logarithm likelihood. Don’t forget to constrain the score for the “Nothing choice” to zero. And we have our results here.
Now that we have completed the discrete choice analysis and obtained the brand weight and price sensitivities, we can use it to build a market simulator that optimizes price.
Market simulator is more than interesting. We get to come up with our set of assumptions and test out different scenarios. In this case, let’s use all of the numbers from our discrete choice analysis, the prices and costs of all three figures remain the same. The market consists of 100 customers. Each One Piece figure collector will purchase 7 figure accessories. And One Piece company sells each accessory for $40 and the cost of each accessory is $30. (Note: These numbers are completely random.)

First, we set up the trial price of One Piece figure. Enter the relevant data (price, cost) of One Piece in any empty cells we prefer.

Then we compute the unit sales of One Piece figure, multiply 100 customer by the probability of One Piece figure chosen (From discrete choice analysis). 100*0.17864=17.864. We then compute the One Piece revenue from figure and accessory with the formula =price* unit sales +unit sales* figures/ person sold*figure price. In this =C7*H9+H9*B10*B11. Enter the costs and compute the profit by subtracting revenue from cost. Run Solver.

Finally, we have yield the profit maximizing price of $207.46. For price optimization, we did not use any of the brand equity or price sensitivity data. So what was the point of the discrete choice analysis? Well, we did use one probability figure, and that was derived from the logistic regression performed in the discrete choice analysis, with brand equity and price sensitivity figures being the inputs.
There are many other applications of discrete choice analysis, such as evaluating brand equity and calculate price elasticity. One step leads to another, this is the interesting part of marketing analytics.

